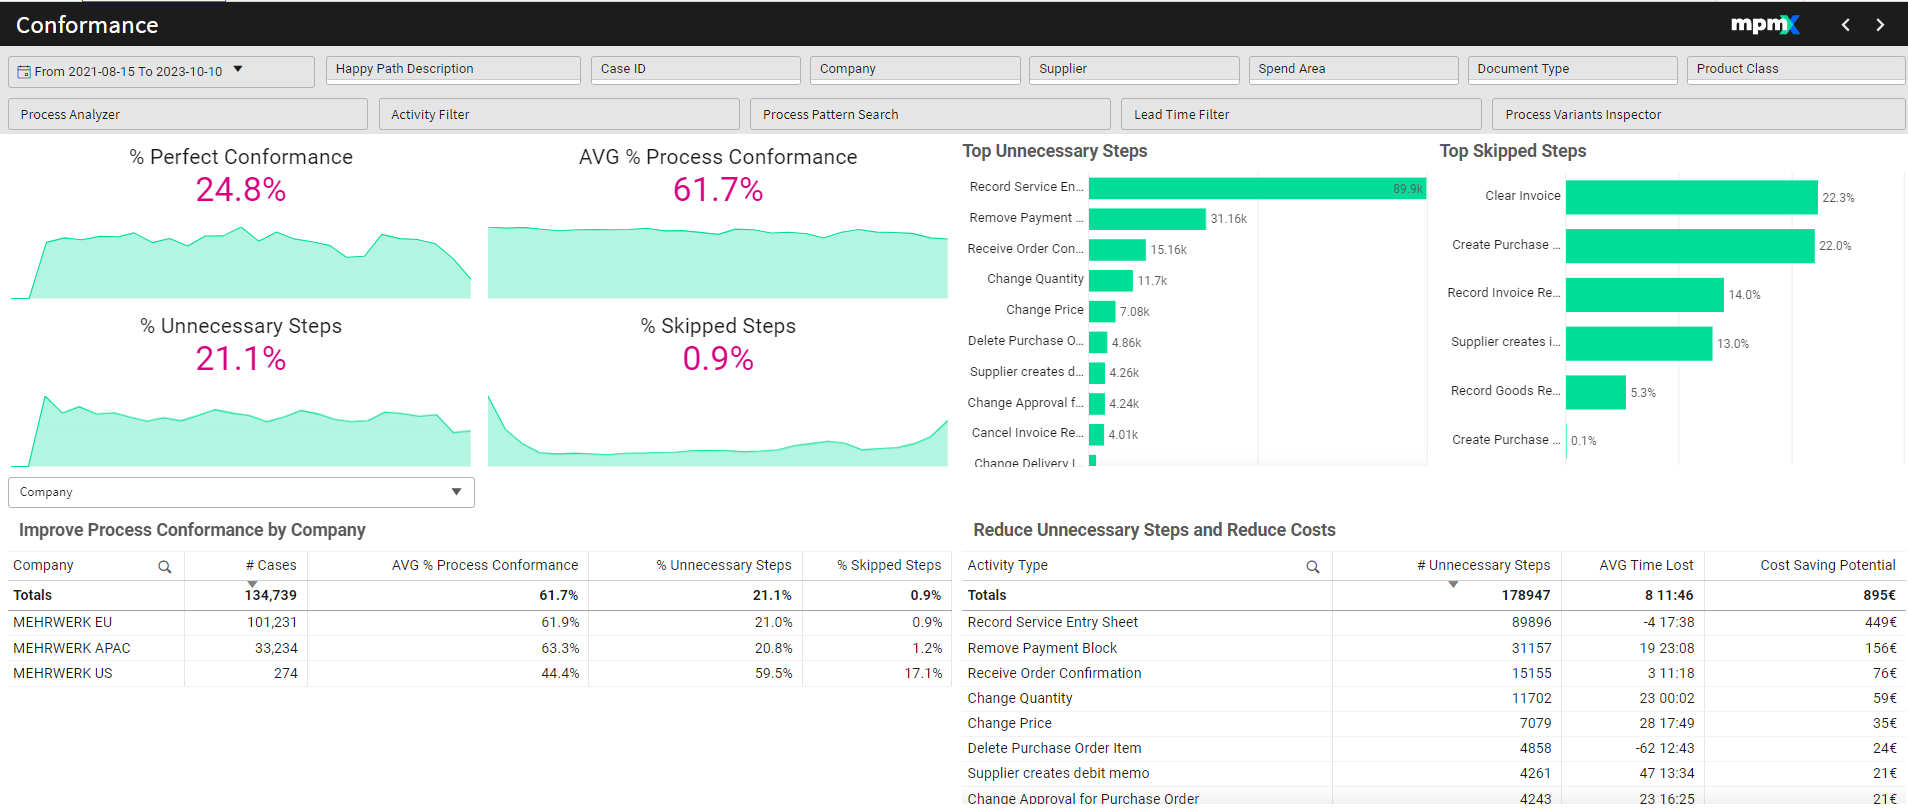
Conformance
The Conformance Sheet compares a defined process model with the actual as-is process to identify deviations. Key performance indicators like Process Conformance and Perfect Conformance help quantify the gap between performance indicators. Users can detect skipped or unnecessary steps and highlight critical deviations. The analysis can be flexibly applied to any process context to evaluate standardization potential. This supports effective process harmonization, reduces deviations, and improves process standardization.
Type: Dashboard
Key Figures
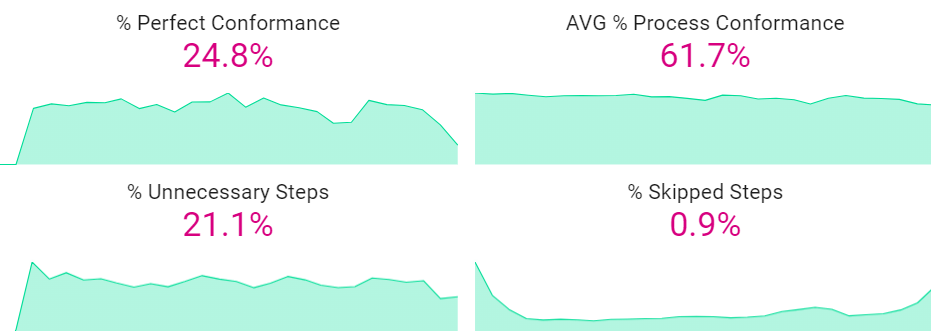
Use the key figures to get a quick overview of the conformance situation.
% Perfect Conformance
- Shows the percentage of cases without a single deviation from the process model.
- A process with 100% would have cases that are perfectly aligned with the model.
AVG % Process Conformance
- Shows the percentage of cases in the current process that conform to the process model or Happy Path(s).
- A process that does not conform to its model can deviate in a few ways.
- It can have added steps not in the model.
- It can skip steps the model requires.
- It can do steps out of order.
% Unnecessary Steps
- Shows the percentage of steps being taken in the process that are not required by the model.
- Here it is good to check if the extra steps are in fact wasted time in the process or should be added to the model as a required step.
% Skipped Steps
- Shows the percentage of steps in the process model that do not occur in the existing cases.
- Here it is good to check if the skipped steps are truly necessary or can be removed from the process model.
Conformance deviations can help identify two things:
- errors in how cases are being performed
- changes that ought to be made to the model to reflect reality or a changed situation
Top Unnecessary Steps | Bar Chart
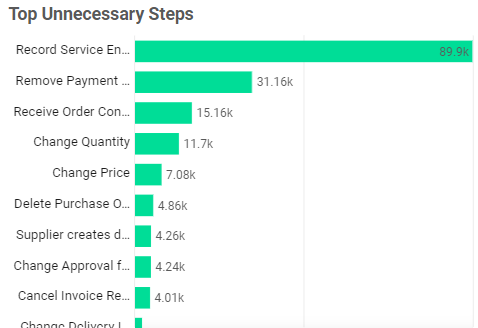
Select one or more bars in the chart to filter the dashboard. For instance, if the top unnecessary step mostly occurs with a particular supplier or product.
Look for steps that may indicate errors in the process or change events which may indicate rework as top optimization potentials.
Reducing a particular high unnecessary step will:
- increase process conformance
- increase control and standardization of the process
- reduce the complexity of the process
- decrease the rework in the process
Top Skipped Steps | Bar Chart
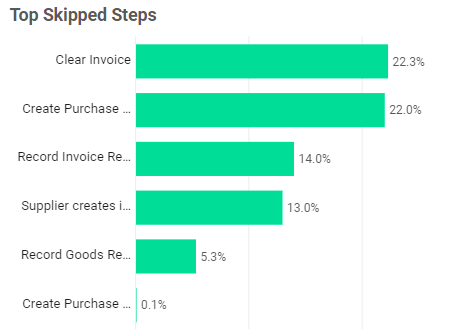
Another insight could be discovering that parts of your process model do not reflect reality anymore because the process has evolved so that some steps are no longer necessary, so the model should be modified.
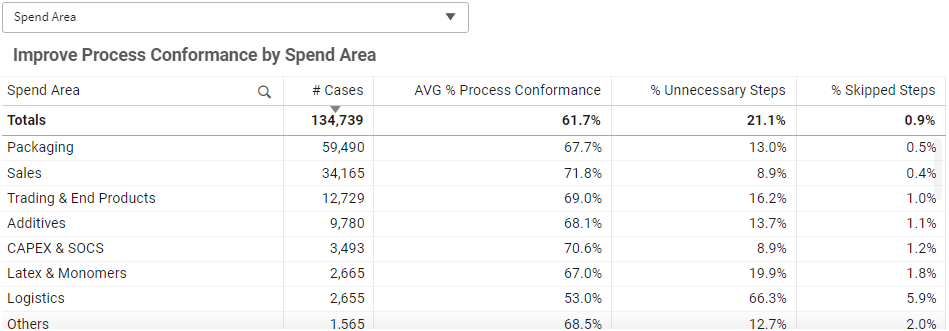
Improve Process Conformance By (Dimension) | Table
Reduce Unnecessary Steps and Reduce Costs | Table
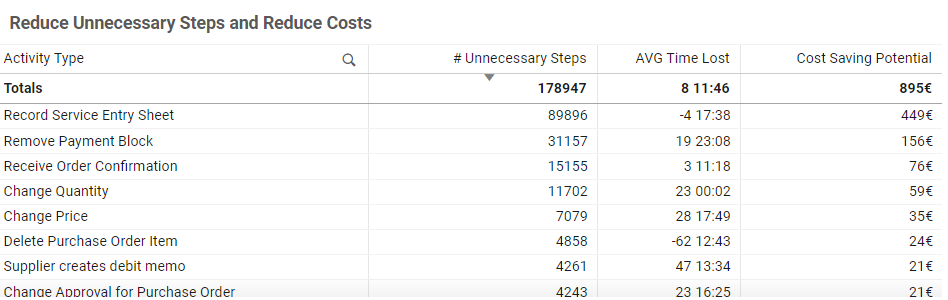
This table highlights unnecessary steps found in the current process that do not appear in the reference process model. These steps can negatively impact performance, particularly in terms of time lost and potential cost savings.
Key Information in the Table:
- Unnecessary Steps: Shows the number of process steps that do not exist in the process model.
- Cases Affected: Shows how often each step occurs in real cases.
- Time Lost (Avg/Median): Indicates the average or median additional time spent on cases that include these unnecessary activities
- Cost Saving Potential (optional): Estimates potential savings if the step was removed.
How to Use the Table:
Sort columns by clicking into the table-header to identify:
- Steps with the highest number of occurrences.
- Steps with the greatest average additional time for cases that include this process step
- Steps with the highest cost-saving potential.
High time impact, low frequency: These steps might distort averages and lead to customer or supplier dissatisfaction, even if they affect only a few cases.
Moderate time impact, high frequency: These are prime candidates for optimization, as they affect many cases and can lead to broader performance improvements.
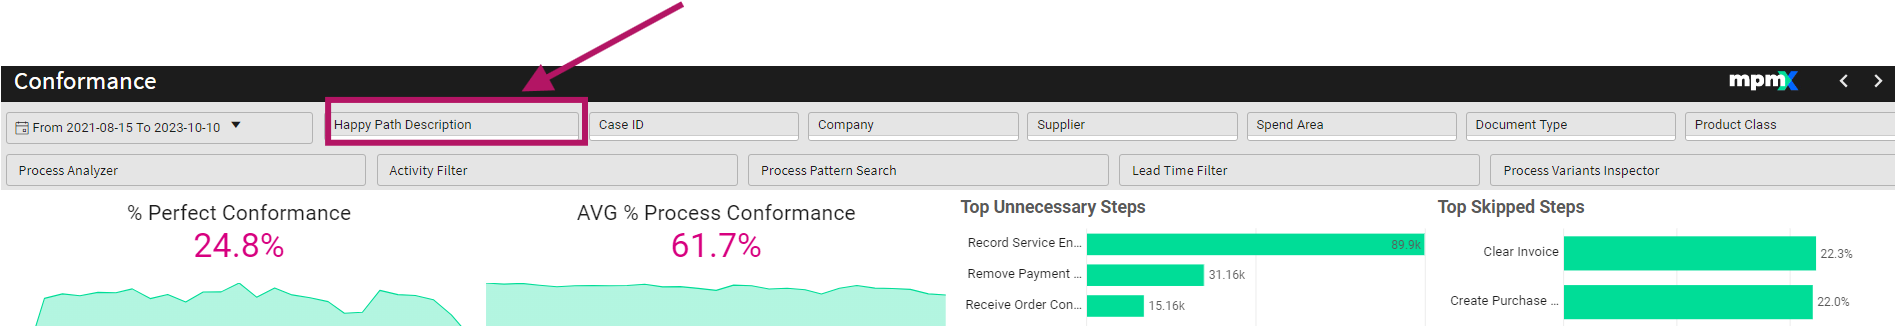
Additional Analysis
Happy Path Description-Button